SRAS→=SRPC←
(imagine the direction of the arrows on the corresponding graphs below)
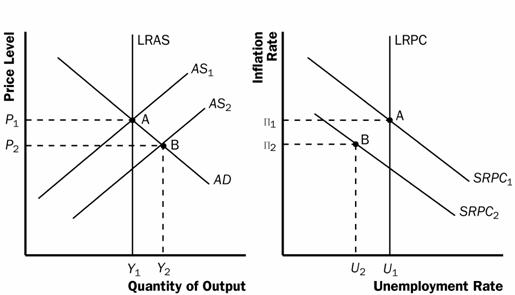
- inflationary expectations ↓, input prices ↓, productivity ↑, business taxes ↓, +/or deregulation
- SRAS→: GDPR↑ and PL ↓; u%↓ and π%↓
- SRPC← (disinflation)
*supply shock→rapid and significant increase in resource cost which causes the SRAS to shift
*NRU→is = to frictional, structural, and seasonal (cyclical based on economy)
- natural rates and fewer worker benefits create a lower NRU (free med. care for all workers, lay-off some b/c profits being eaten)
*misery index→combo. of inflation (2-3%) and unemployment (double digits=depression, forget a recession) in any given year. Single digit misery is good.
*if inflation rate persists and expected rate of unemployment rises, then entire SRPC moves upward. When that happens, stagflation exists.
*if inflation expectations drop (due to new tech., efficiency, etc.), the SRPC moves downward
*stagflation→↑ unemployment and ↑inflation occurring at same time
*disinflation→when inflation decreases over time
- nominal wages ↓ (good)
- business profits fall as prices ↑ (bad)
- firms reduce employment, thus, unemployment ↑
No comments:
Post a Comment