Saturday, April 27, 2013

Foreign Exchange (FOREX)

Foreign Exchange→buying and selling of currency
EX) In order to purchase souvenirs in France, it is first necessary for America to sell (supply) their dollars and buy (demand) Euros.

*The exchange rate (e) is determined in foreign currency markets
EX) The current exchange rate is approximately 77 Japanese yen to 1 U.S. dollar.

*Simply put: exchange rate is price of a currency
*do not try to calculate the exact exchange rate
*increase in demand of Euros relative to U.S. dollar


Extra: Credits vs. Debits

Creditsaddition to a nation's account
Debits→subtractions to a nation's account

How to Calculate the following:
1. Balance of Trade: merchandise ↓ service exports-merchandise ↓service imports (typically)
2. Trade deficit occurs when the balance on trade is negative (imports>exports)/ Trade surplus occurs when the balance on trade is positive (exports>imports)
3. Balance on current account=Balance on trade (exports & imports)+Net investment income+Transfer payments
4. Official Reserves
*nationally

Δ in CA+Δ in FA+Δ in official reserves=not zero

Unit VII: Balance of Payments

Balance of Payments→measure of $ inflows and outflows b/t U.S. and rest of world (ROW)

  • inflows referred to as "CREDITS"
  • outflows referred to as "DEBITS"
They are divided into 3 accounts:
  1. current account
  2. capital/financial account
  3. official reserves account
Double Entry Bookkeeping:
*every transaction in balance of payments is recorded twice in accordance w/ standard accounting practice
EX) U.S. manufacturer, John Deere, exports $50 million worth of farm equipment to Ireland.
-a credit of $50 mill. to current account 
(-$50 mill. worth of farm equipment or physical assets)
-a debit of $50 mill. to capital/financial account
(+$50 mill. worth of Euros or financial assets)
-notice that the 2 transactions offset (balance) each other. Theoretically, the balance payments should always =0.

Current Account:
1. Balance of Trade of Net Exports
  • exports of goods & services --imports of goods & services
  • exports create a CREDIT to balance of payments
  • imports create a DEBIT to balance of payments
2. Net Foreign Income
  • income earned by U.S. owned foreign assets--income paid to foreign held U.S. assets
  • EX) Interest payments on U.S. owned Brazilian bonds--interest payments on German owned U.S. treasury bonds
3. Net Transfers (tend to be unilateral→one-sided)
  • foreign aid→debit to current account
  • EX) Mexican migrant workers send $ to family in Mexico
Capital/Financial Account
*the balance of capital ownership
*includes purchase of both real and financial assets
*direct investment in U.S. is a credit to capital account
EX) Toyota Factory in San Antonio
*direct investment by U.S. firms/individuals in a foreign country are debits to capital account
EX) the Intel Factory in San Jose, Costa Rica
*purchase of foreign financial assets represents a debit to capital account
EX) Warren Buffet (a wealthy man) buys stock in Petrochina
*purchase of domestic financial assets by foreigners represents a credit to capital account
EX) United Arab Emirates sovereign wealth fund purchases a large stake in NASDAQ

What Causes Capital/Financial Flows?
*differences in rates of return on investment
*Ceteris Paribus ("with other things the same" or "all other things being equal"), savings will flow toward higher returns

     
Relationship b/t Current & Capital Account
*current account and capital account should zero each other out (+/-; surplus/deficit)
EX) The constant net inflow of foreign financial capital to U.S. (capital account surplus) is what enables us to import more than we export (current account deficit)

Official Reserves
*foreign currency holdings of U.S. Federal Reserve System
*when there is a balance of payments surplus, the Fed accumulates foreign currency and debits the balance of payments
*when there is a balance of payments deficit, the Fed depletes its reserves of foreign currency and credits balances of payments 
*official reserves zero out the balance (everything)
*active vs. passive

Helpful Guide:

Reaganomics

Supply-side economics or Reaganomics:

  1. support policies that promote GDP growth by arguing that high marginal tax rates along w/ current system of transfer payments (i.e. unemployment compensation and social security) provide disincentives to work, invest, innovate, and take entrepreneurial adventures
  2. believe AS curve will determine levels of inflation, unemployment, and economics growth
Trickle-down Effect
*Rich→poor (direction of $ flow)

Marginal Tax Rate→amount paid on last $ earned or on each additional $ earned
  • Reaganomics believe if you reduce the marginal tax rate, more people will be inclined to work longer, thus forgoing leisure time for extra income. 

Laffer Curve

**higher the tax rate you set, less $ you will collect
**Laffer Curve is controversial and debatable


*trade-off b/t tax rates and govt revenue
*as tax rates ↑ from 0, tax revenues ↑ from 0 to some max level, and then decline
*higher tax rates, less $ you collect
*Criticisms:


  1. where economy is located on curve, it is difficult to determine
  2. tax cuts also ↑ demand which can fuel inflation
  3. empirical evidence suggests that impact on tax rates on incentives to work, save, and invest are small


Friday, April 26, 2013

Phillips Curve Cont.

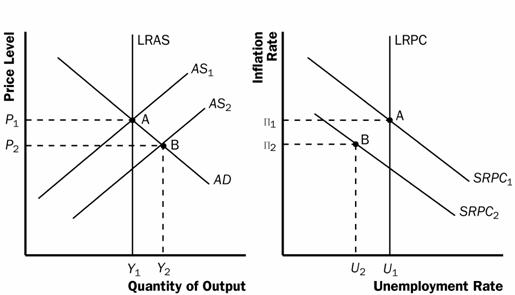
SRAS→=SRPC←
(imagine the direction of the arrows on the corresponding graphs below)

  • inflationary expectations ↓, input prices ↓, productivity ↑, business taxes ↓, +/or deregulation
  • SRAS→: GDPR↑ and PL ↓; u%↓ and π%↓
  • SRPC← (disinflation)
 *supply shock→rapid and significant increase in resource cost which causes the SRAS to shift
*NRU→is = to frictional, structural, and seasonal (cyclical based on economy)
  • natural rates and fewer worker benefits create a lower NRU (free med. care for all workers, lay-off some b/c profits being eaten)
*misery index→combo. of inflation (2-3%) and unemployment (double digits=depression, forget a recession) in any given year. Single digit misery is good. 
*if inflation rate persists and expected rate of unemployment rises, then entire SRPC moves upward. When that happens, stagflation exists. 
*if inflation expectations drop (due to new tech., efficiency, etc.), the SRPC moves downward

*stagflation→↑ unemployment and ↑inflation occurring at same time
*disinflation→when inflation decreases over time 
  • nominal wages ↓ (good)
  • business profits fall as prices ↑ (bad)
  • firms reduce employment, thus, unemployment ↑

Unit VI: The Phillips Curve

u%=unemployment rate
π%=rate of inflation


*The Phillips Curve represents the relationship b/t unemployment and inflation
*trade-off b/t unemployment and inflation occurs over SR
*each point on the Phillips Curve corresponds to a different level of output
*LRPC=long run Phillips Curve
  • occurs at NRU
  • represented by ↨ line
  • no trade-off b/t unemployment and inflation in LR
  1. economy produces @ FE output level
  2. nominal wages of workers fully incorporates any changes in PL as wages adjust to inflation over the LR
*LRPC only shifts when LRAS shifts (both have the same determinants)
*↑ in unemployment, LRPC →
*↓ in unemployment, LRPC ←
*Increase in AD=up/left movement along SRPC 

  • C↑, Ig↑, G↑, and/or Xn↑
  • AD→: GDPR↑ and PL ↑; u%↓ and π%↑; up/left along SRPC
  • this would be depicted in the graph below 
*Decrease in AD=down/right along SRPC
  • C↓, Ig↓, G↓, and/or Xn↓
  • AD←: GDPR↓ and PL↓; u%↑ and π%↓; down/right along SRPC
  • in this case, point B would move to point A in the graph below


**Check out this blog for more info. on the Phillips Curve and other economic topics: http://macroeconomic1.wordpress.com/